

How do you use htop in Linux?

If you are looking for something on Linux that is very similar to Task Manager in Windows or Activity Monitor in macOS, htop is probably your best friend.
htop can be started and stopped by pressing q, F10, or Ctrl+C.
It often comes preinstalled with the operating system. Otherwise you can easily
install it via your favourite package manager (apt, dnf, brew, etc.).
Unlike Task Manager and Activity Monitor, htop is not a GUI application. It’s still fairly easy to use though!
What does everything mean?

htop shows you a lot of different values about your systems and its processes. I’ll go through each of these, starting at the top of the screen.
Bar graphs
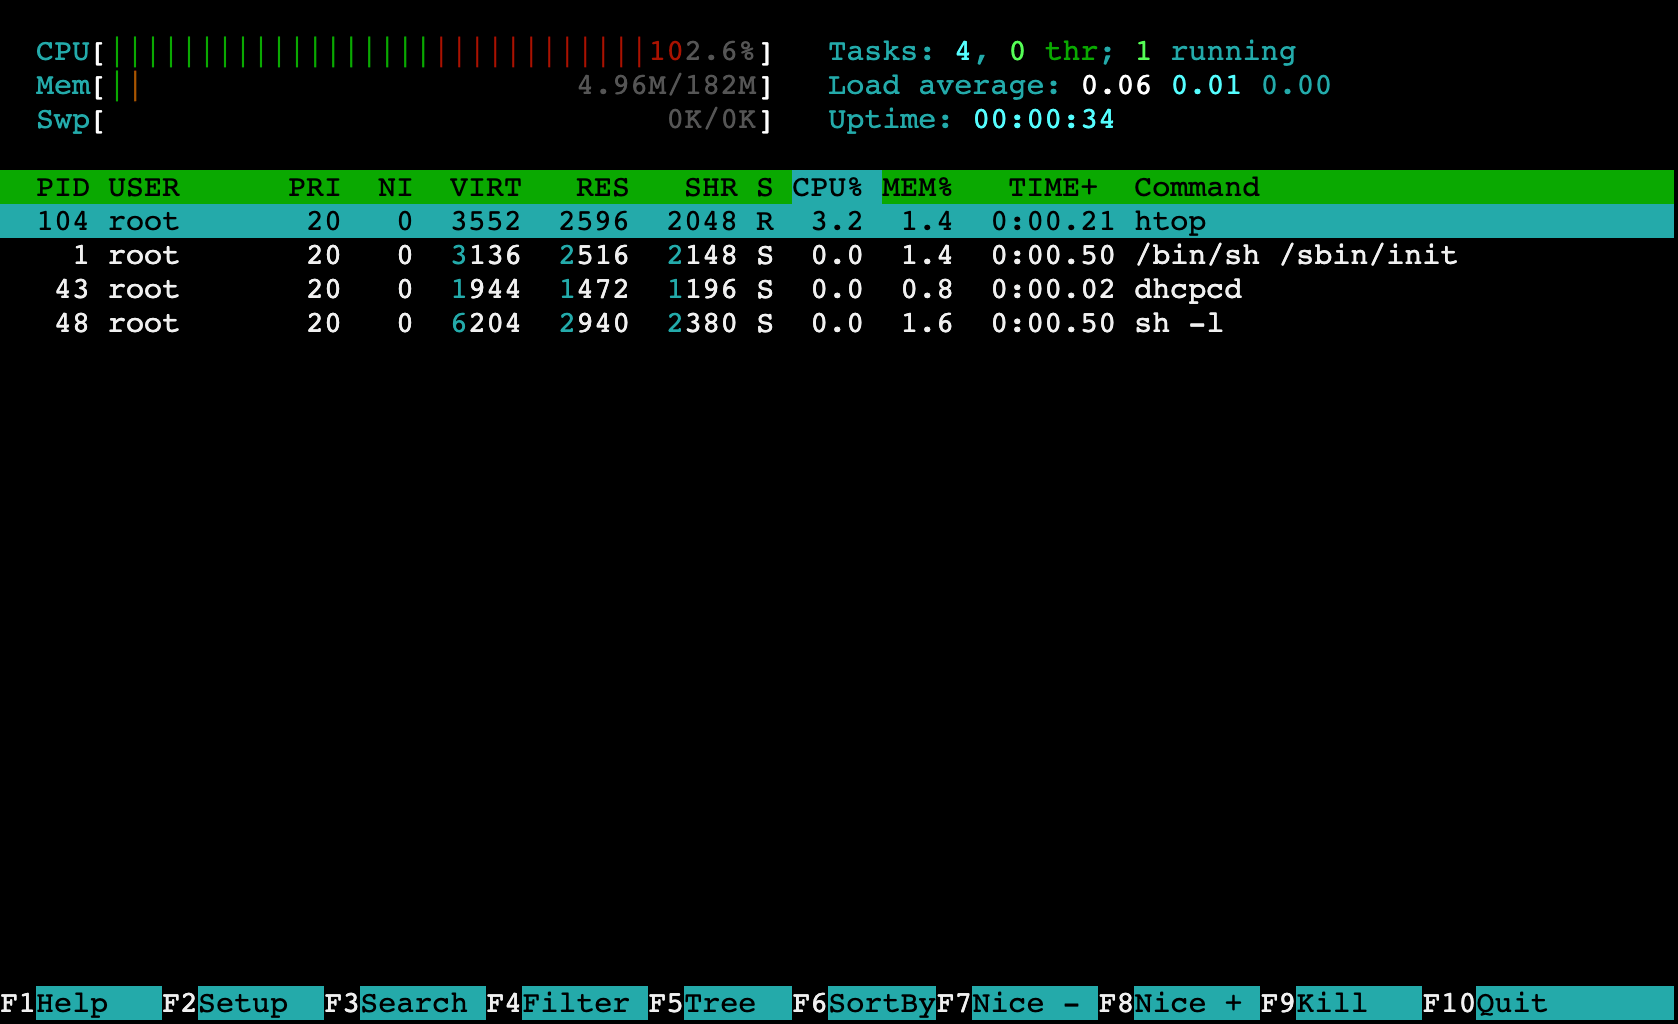
At the top of the screen you can find some bar graphs. These give you a general idea of how the system is currently doing. The precise values don’t really matter, although you may want to take a closer look at some of the other statistics if one or more bars are .
CPU
The first bar shows your current CPU usage. If the machine has access to multiple CPU cores, each logical core gets its own (numbered) bar. Note that the number of logical cores can be twice as high as the .
If you look closely at the bar graphs, you’ll notice that not all bars are in the same colour. Red bars denote CPU cycles spent on kernel processes, blue bars are for normal processes, and blue bars for .
Mem
How much memory is currently used, .
Green bars denote used memory, blue bars are for buffers, while orange bars represent memory that is used for cache.
Lower is usually better, although in reality it’s a bit more nuanced:
-
If values are consistently very low, the machine may have more memory than needed. This is not necessarily a problem, unless you’re paying for extra RAM.
-
A very high value is also not necessarily bad, as it means your memory is put to good use.
Swp
Machines only have a limited amount of memory, but sometimes you run into situations where your processes need more memory than is physically available. When this happens the system doesn’t (usually) simply give up. Instead, some parts of the machine’s working memory that have not been used for a while are temporarily copied to disk so that they can make room for newer data.
Any value above 0 is a sign that your machine needs more memory. Because disk storage isn’t as fast as memory, you’ll likely notice that your machine runs slower than usual.
Tasks, load average, and uptime
In the top right corner you can find some values that provide a slightly more detailed summary of what’s going on.
Tasks
Tasks shows the total number of running processes. This number isn’t very interesting unless you know how many processes are usually active on the machine.
thr
thr (threads) shows the number of threads, and how many are actively
running right now. This information can be useful in some cases.
Note that a single process can have multiple threads.
Load average
“Load average” shows three different numbers. These numbers tell you what the average system load was in the last 1, 5, and 15 minutes respectively, as a decimal value. You should primarily look at the last two numbers.
Values are normally somewhere between 0.00 and the number of cores in your
machine. High values could be a sign that your machine needs more processing
power. As a rule of thumb:
-
if the load is consistently above 70% of the number of cores (on a machine with 4 cores this would be 0.7 ⨉ 4 =
2.80), it’s probably a good idea to take a better look at what is happening; -
if the load is consistently higher than the number of cores (on a machine with 4 cores this would be
4.00), then the machine has trouble keeping up with all the work and you may have a problem; -
if the load is way more than the number of cores in your system, it is so high that the system is becoming unresponsive, which means that you have a huge problem that you need to fix right now.
Uptime
This tells you how much time has passed since the machine was started. Unlike the “load average”, this value means exactly what you think it means.
The process list
The process list is displayed on the bottom half of the screen. You can navigate through and select processes in this list using the arrow keys on your keyboard. Sometimes you can also click on processes and scroll through the list using your mouse or trackpad.
PID
Each process that is started on a machine is assigned a unique ID. Knowing this ID lets you do all kinds of interesting things, like .
USER
Processes are owned by a user. In the screenshot above, all processes are owned
by root. Your own processes should ordinarily run under your own account name
or some purpose-specific user, like www-data.
PRI
Processes do not really run simultaneously on a CPU. Instead, computers run different processes after each other for very short periods. This gives you the illusion that they run simultaneously.
Not all processes are the same: some processes are more important than others: they have a higher priority. Your machine will try to spend more time on processes with a higher priority. The priority of a process cannot be set directly.
NI
Niceness is best seen as the opposite of priority. A process that is very nice has a high value (19) and will let other processes go first, while a process that is very not nice has a low value (-20) and will try to go first itself.
Unlike priority, this can be set manually executing the nice or renice
commands with the right PID and niceness level.
VIRT
VIRT refers to how much virtual memory a process thinks it has. This number
is usually a lot larger than the actual amount of memory that is available on
the machine. This is nothing to worry about. In fact, in most cases this value is
completely useless.
RES
The column for resident memory usage tells you how much memory is a process actually uses right now. This number is a bit more useful.
Note that this value does not include any swapped memory. It is also possible
that some of the memory is shared with another process, so adding up all RES
values might result in a larger number than what is available on the machine.
SHR
SHR is the amount of shared memory that is used by a process, within VIRT.
For most people this is therefore also not a very useful number.
S
S stands for process state. Processes are normally in one of the following
states:
-
R: the process is running -
S: the process is sleeping (waiting) and can be interrupted (stopped) -
D: the process is sleeping, but you can’t interrupt it -
T: the process has been stopped temporarily -
Z: the process is a zombie process. These processes don’t do anything and are normally removed pretty quickly. Otherwise something probably went wrong.
In some operating systems you might also see ?. This is not a state; it means
that htop does not have permission to request the state.
CPU%
What percentage of the CPU the process has consumed in the last three seconds.
This number can be higher than 100% if the process uses multiple threads, and can sometimes be ludicrously high.
MEM%
What percentage of the resident memory the process has consumed in the last three seconds.
TIME+
TIME+ shows how much time a (any) CPU has spent on the process, in
minutes:seconds.hundredths. This does not tell you how long the process has
been running.
Command
Command shows the command that directly led to the start of the process.
This is not necessarily the same as the command, script, or application that you
started.
Things that you can do with htop
htop is a very handy tool for viewing the state of your system and its processes, but you can also use it to do things!
Find a specific process
The list of processes can be very long. If you know the command (or name) of your
process, you can easily find it by pressing F3 or /, and typing its name.
htop will highlight the row of the process to indicate that you have selected
the process. If multiple process match your search query, you can press F3 to
view and select the next result.
View processes in a tree
A process can spawn zero or more child processes. All processes together form a
process tree. If you feel that the process list is too cluttered, you may want
to give the tree view (F5) a try. This gives you a more organised, logical view
of the processes running on your machine. You can revert to the list view using
the F5 key.
Sort processes
Processes are sorted by CPU% by default. However, if you want you can also sort
it by any other column by pressing F6, selecting one of the columns on the
left side of the screen, and pressing Enter to confirm your preferred sorting order.
If you have a mouse, you might also be able to sort the process list by clicking on the column name.
Change the priority of processes
I already briefly discussed how processes have different priorities and
how you can make sure that a process gets a higher or lower priority by setting
its niceness using the nice and renice commands.
While selecting a process in htop, you can also press F7 to increase its
priority or F8 to lower its priority. This should trigger a change of the NI
value of the process. If F7 doesn’t appear to do anything, you may need to
start htop with sudo privileges (sudo htop).
Stop a process
If a process is misbehaving (or you simply want to get rid of it) you can stop
it by selecting it in htop and pressing the F9 key. This will show a very long
list of “signals” on the left side of the screen.
The 15 SIGTERM option is selected by default and good enough for most
situations. If that doesn’t work, . Unless you know what
you’re doing, these are the only two options you’ll ever need.
Either way, make sure you press Enter to confirm your choice. The process should disappear from the list shortly.
Summary
You can use htop to…
-
view the current average system load
-
view all running processes on your machine
-
make processes run with a different priority
-
stop processes